Google Earth Flight Tracks-Part 2
WORKING WITH LOG FILES
Your Host: Larry Dunn (MrE on RC Groups)
Working With Log Files
Ok, if you’ve gotten Companion and Google Earth configured (Configure Google Earth and Companion) go fly your model with the GPS sensor in it. Be sure to remember to turn ON logging before you launch and turn it OFF after you land. You should now have a log file, with GPS data to work with, on the SD-Card in the TX.
I prefer to copy the log files to my computer at the end of a day’s flying so I can save them. They also load a little faster than reading them from the SD-card in Companion, but it’s not necessary to do that. If you decide to copy them to your computer, you will need to make a note of where you saved them.
If you have 2.0.xx on the transmitter, hold the rudder and aileron trim switches to the center at the same time while turning it ON. That puts the transmitter in Boot Loader mode. Now plug a USB cable into the back. In a few seconds your computer should recognize two new drives. One of them should be named ‘Taranis’. Leave that one alone. It contains the firmware files.
The other new drive will have several folders in it. The one you want is called ‘Logs’. Inside that folder will be your log files. You will have a separate log file for each day of flying for each model you flew on that day. For example, if you flew the same model three different times on the same day, all of those logs will be stored in the same file – even if you start and stop the logging multiple times. Don’t worry, you can select out individual flights easily when viewing them.
The files will have the name of the model and the date in them. For example, my log files for the Supra look like this: Supra-2014-09-01.csv. That log file contains the data from all my flights with the Supra on 1 Sept., 2014. If you fly more than one model on the same day, each model will have a separate file starting with its model name. I also have another log file named Bubbledancer-2014-09-01.csv because I flew both models on 1 Aug.
Now that you know what to look for, you can copy the log files to a folder on your computer or leave them on the SD-card.
VIEWING LOGS
With the transmitter is in Boot Loader mode (trims to center and turned ON) and plugged into the USB port, it’s time to start Companion and open the log viewer. You can start the Log Viewer by going to the File menu and clicking on ‘View Log File’ or by clicking on the ‘View Log File’ icon.
In the top right corner is a button labeled ‘Open Log File’. Click on that button and navigate to the folder where the log files are stored. If you copied the files to your computer, then go to that folder. If they are still on the SD-card, then navigate to that folder and click on the log file you want to view.

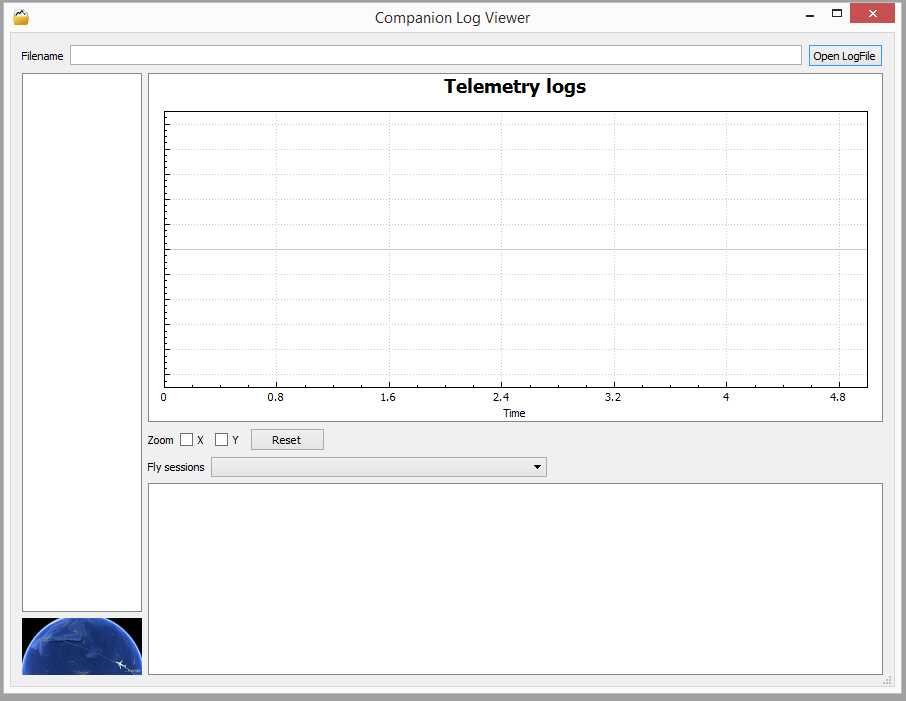
Blank Log Viewer Window in Companionhttp://www.open-tx.org/screens-taranis.html
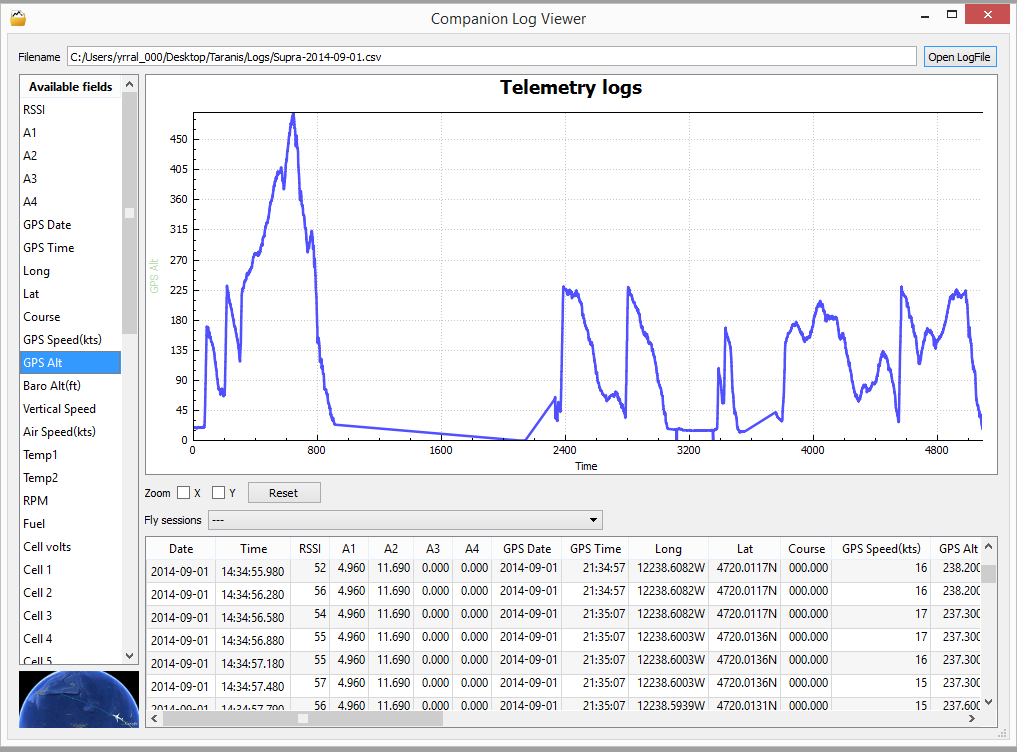
If the file is a large one, it can take a minute or more to load. Some of my early log files were huge – I forgot to turn OFF logging between flights – and they sometimes took several minutes to load! Once the log file loads, you will see the screen below. In this shot, I have clicked on ‘GPS Alt’ in the left column and all the flights from that day show up in the graph. In this example, there are four separate logged flights.
I’m not going to go into a lot of detail on how to use the log viewer to view graphs of your logged data. You can play with that and see how it works fairly easily. Basically, you click on whatever you want to see from the left column where it says ‘Available Fields’. RSSI and A1 are always available as well as stick and switch positions. Other than those, only items for which you have a sensor installed will show on the graph. GPS data is only available if you have the GPS sensor installed, A2 will only show up if you have a voltage sensor installed, etc.
One neat trick I will mention is that you can see graphs of two or more different sets of data at the same time. For example, you can click on RSSI and then hold down CONTROL and click on GPS Alt for example and both graphs will be displayed at the same time. You can see how RSSI varies with altitude. Or you could compare your receiver voltage over time compared to throttle position or anything else. This can be very handy for analyzing flight data of all types. For our purposes in this class – looking at our Flight Track on Google Earth, we are almost done.
Remember earlier I mentioned that your log files have all the flights from one day saved together? You can view individual flights by clicking on the ‘Fly Sessions’ drop down box. Each individual flight from that day will be listed in order. Select one and only the data from that particular flight will be displayed. If you don’t select an individual flight, then all the flights will be shown at the same time – as in the picture above. Below is the same GPS Alt data from the first logged flight of that day.

GPS Altitude Data (NOT from Vario Sensor)
VIEWING YOUR FLIGHTS IN GOOGLE EARTH
In the lower left corner of the Log Viewer screen, you will see a satellite view of part of the earth. Click on that picture and Google Earth will start up.
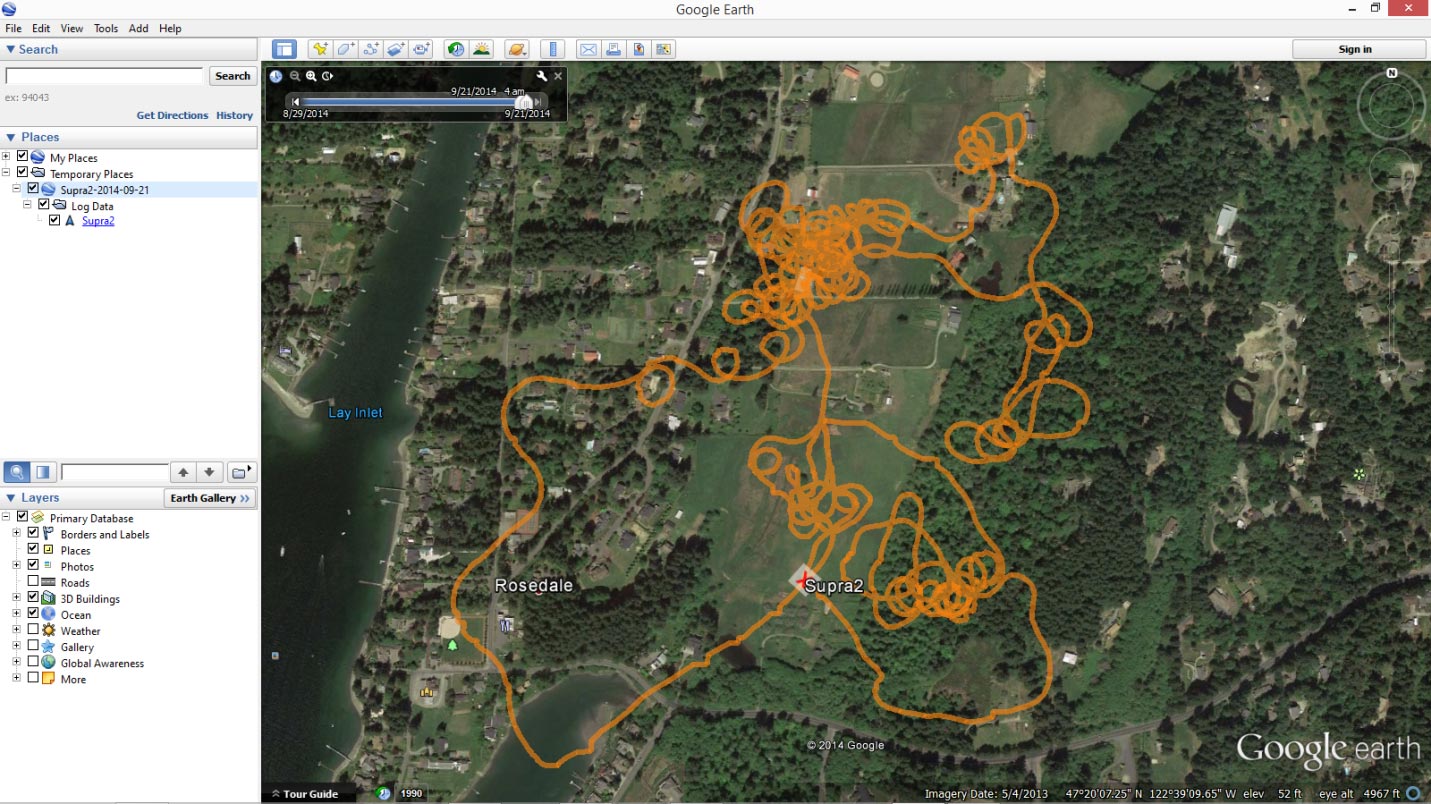
I’m not sure what’s going on, but Google Earth almost always starts up and sends me to the Caribbean or someplace in North Africa when I do this. If it does the same to you, just drag the earth around until you are looking at your actual location. I happen to be in the north western US in Washington State. Once you get to your location and zoom in, this is what you should see.
Google Earth Displaying Flight Track
Google Earth always starts up with the view at some sort of angle. I like to hold Alt and press ‘U’ at the same time to get a direct overhead view.
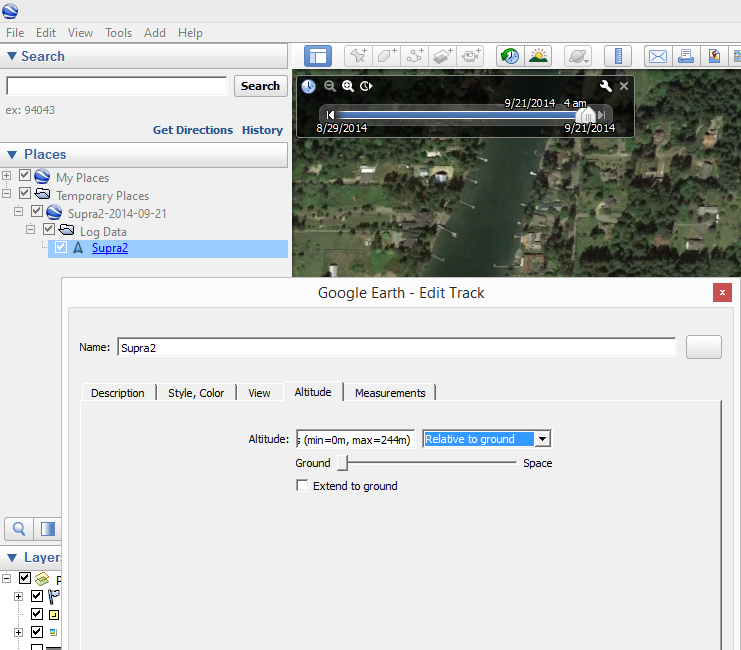
In the top left part of the screen, under ‘Temporary Places’, you should see your flight track listed. Right click on it and select ‘Properties’. Click on the ‘Altitude’ tab and change the drop down box from ‘Absolute’ to ‘Relative to Ground’. If you don’t do that, then portions of your flight track will be underground!
 Google Earth Displaying Altitude Track
If you have selected a single flight in the log viewer under ‘Fly Sessions’, then only that one flight will show up in Google Earth. If not, then all the flights for that day will be shown at the same time. That can get a little busy if you have made several flights. There is also a player bar in the top left corner of the screen that you can use to play back the track. For me, that doesn’t work well unless it is slowed way down. It’s a very cool feature though.
That’s about all there is to it. You can use Google Earth to zoom in or change your viewpoint from overhead to a ground level view, look at it from different angles, etc. You can also save the images from within Google Earth or do a screen capture if you want to share your flights or save them for future reference.
I have learned several very interesting things by looking at these tracks. For one thing, I found I am often flying much further away from my launch point than I realized. I have also been able to spot places where thermals seem likely to be generated. Now I know why certain parts of the field tend to have better lift than other parts depending on wind direction.
I hope you have found this lesson helpful and wish you good lift!


